ZeitMind x Controlling

ZeitMind turns Forecast vs Actual P&L data into a daily, prioritized performance cockpit. Finance teams get executive-ready deviation alerts, can explain EBIT, Sales, and Unit variances with waterfall views, and drill from headline KPI to root cause in the same interface. To shift monthly reviews from spreadsheet reconciliation to faster, more accountable decision-making.

What We Offer

  1. Detect deviations early across Sales, Cost, Margin, and EBIT using Forecast vs Actual thresholds by business unit.
  2. Quantify impact in both financial value and operational units so teams focus on what matters.
  3. Explain the drivers that bridge forecast to actual by region and business unit.
  4. Turn alerts into investigation paths with interactive drill-downs across P&L hierarchy, account groupings, and KPIs.
  5. Offload repetitive analysis work to a built-in AI assistant that answers business questions in context.

The Problem We Solve

Most finance organisations face the same patterns:

  • Forecast vs Actual analysis is spread across fragmented Excel files and static reports.
  • Top-level EBIT gaps are visible, but the drivers stay buried across entities, regions, and accounts.
  • Teams spend hours reconciling numbers instead of acting on them.
  • Even when deviations are detected, ownership and follow-through are unclear.

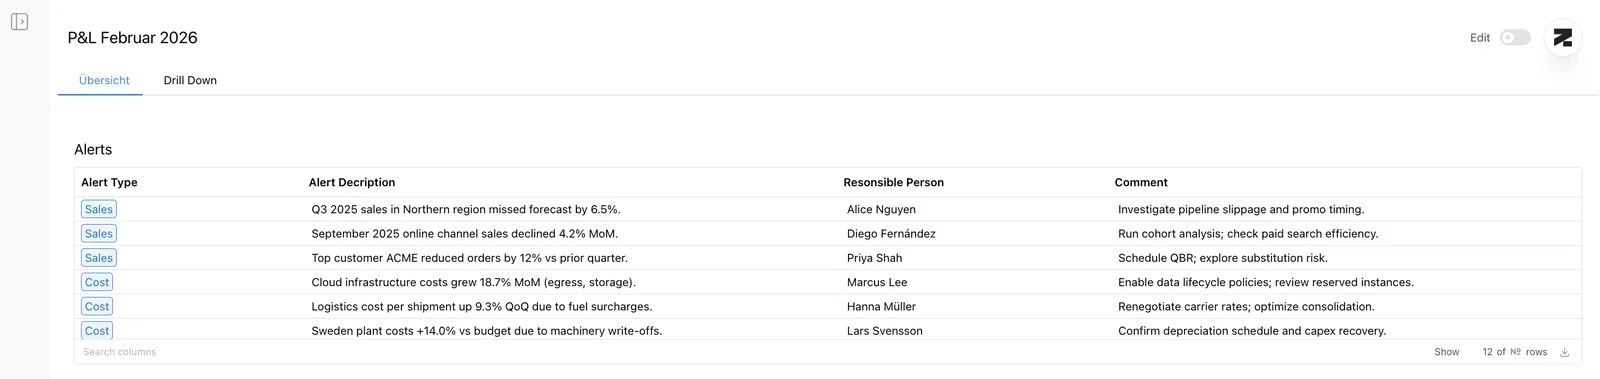
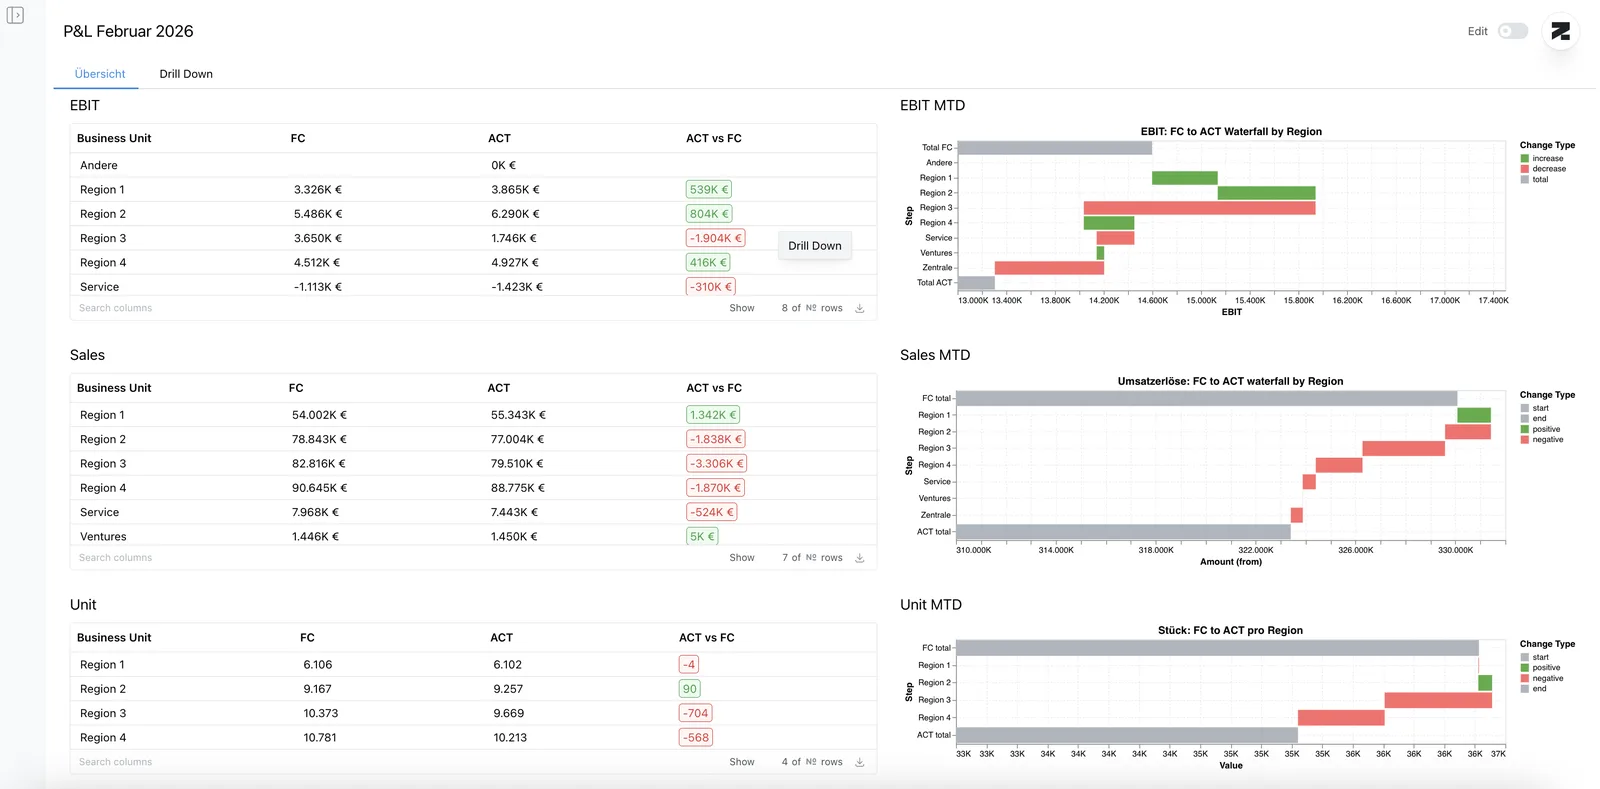
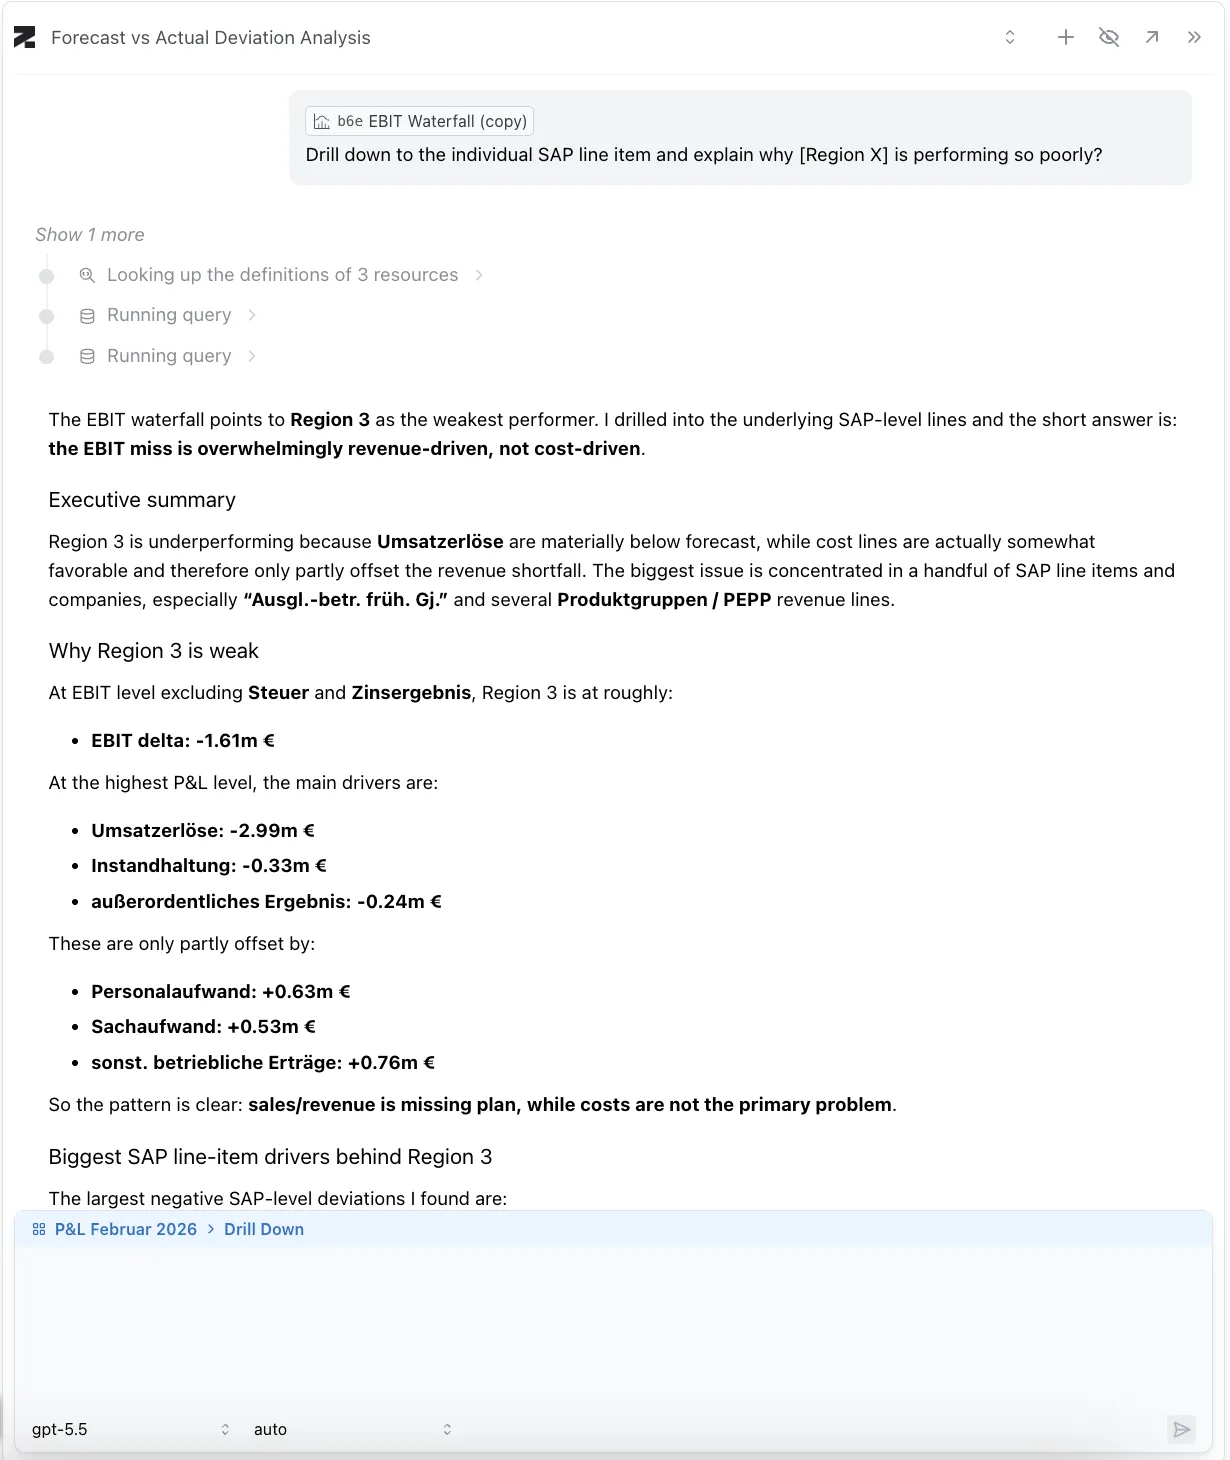
ZeitMind closes the gap between insight and execution by surfacing material deviations, explaining them with waterfalls and drill-downs, and routing them to the right owner in the same interface.

Proactive Alerts

  • Sales, cost, and margin alerts highlight business units and accounts moving materially against forecast.
  • EBIT deviations are surfaced with their financial impact so teams can prioritize what to act on first.
  • Each alert ships with a type, description, owner, and recommended next step. Turning reporting into a starting point for action.

Interactive Drill-Downs

  • Move from headline KPI to root cause without exporting to Excel.
  • Filter and pivot across business unit, region, P&L hierarchy, account groupings, and operational KPIs.
  • Waterfall charts bridge forecast to actual by region, ranking the biggest positive and negative contributors at a glance.

Offload Repetitive Tasks to AI

  • A built-in AI assistant answers business questions directly in the context of your data.
  • Ask things like "Why is EBIT below forecast?", "Which business unit drives the sales deviation?", or "Which alerts should we prioritize this month?".
  • The repetitive prep work such as pulling numbers, framing variances, summarizing movements, shifts to the assistant, so analysts focus on judgment and recommendations.

See Controlling in Action

Book a personalized demo and see how ZeitMind turns your Forecast vs Actual data into a prioritized performance cockpit.

Book a Demo